As we grew from 10 employees to over 80, our toolbox evolved for the better. Here’s a handful of free or low-cost tools that we used along the way:
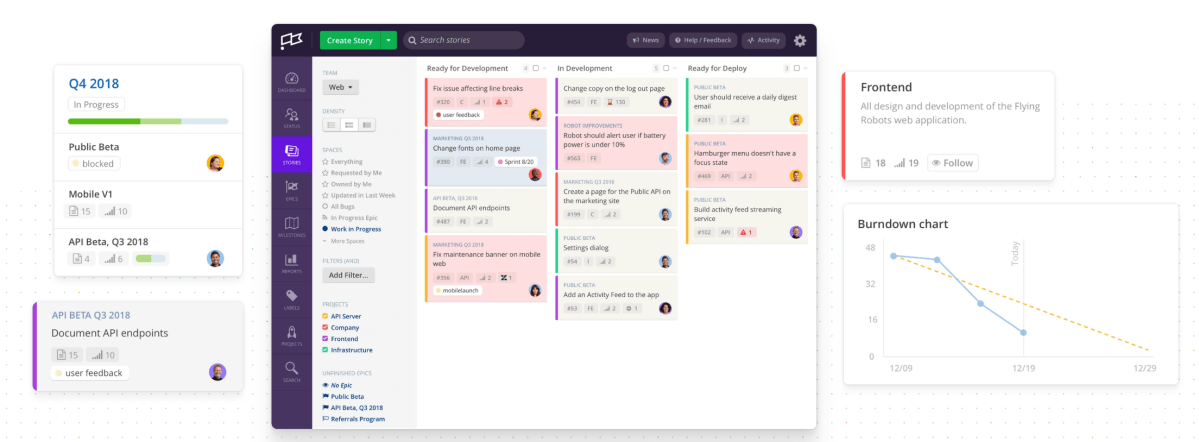
Clubhouse: For managing, tracking, and communicating product priorities with Product & Engineering teams. We started out using Trello’s free membership, but moved to Clubhouse to make communication easier once our combined teams grew beyond 10 people. Clubhouse is more tailored for software development, making it easier for us to cross-create and collaborate on agile processes, bug reporting, and documentation. (Free)
From clubhouse.io
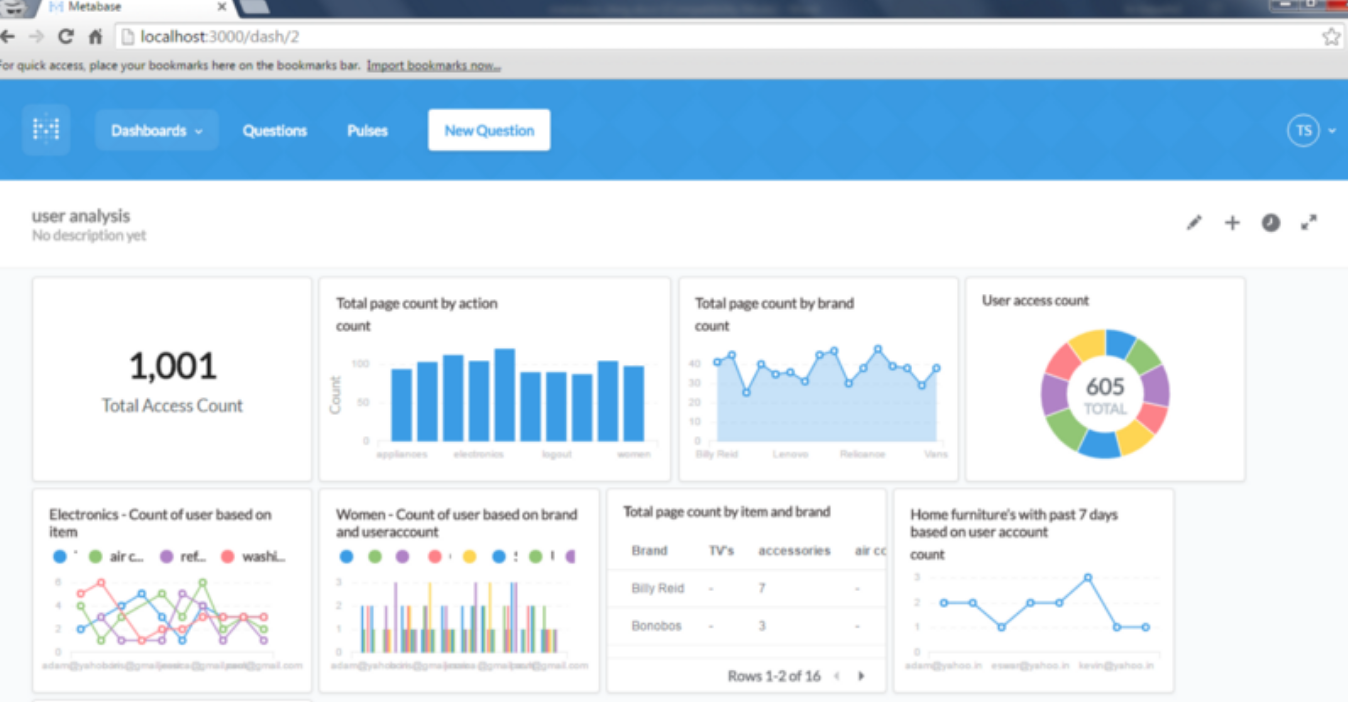
Metabase: For creating dashboards w/o SQL. Metabase allows anyone to query and learn from data, and create visualizations using its ‘questions’ tools. It proves to be very powerful and empowering across the company! However, it required a lot of initial effort from our BI team, needing its own server and infrastructure maintenance. (Free)
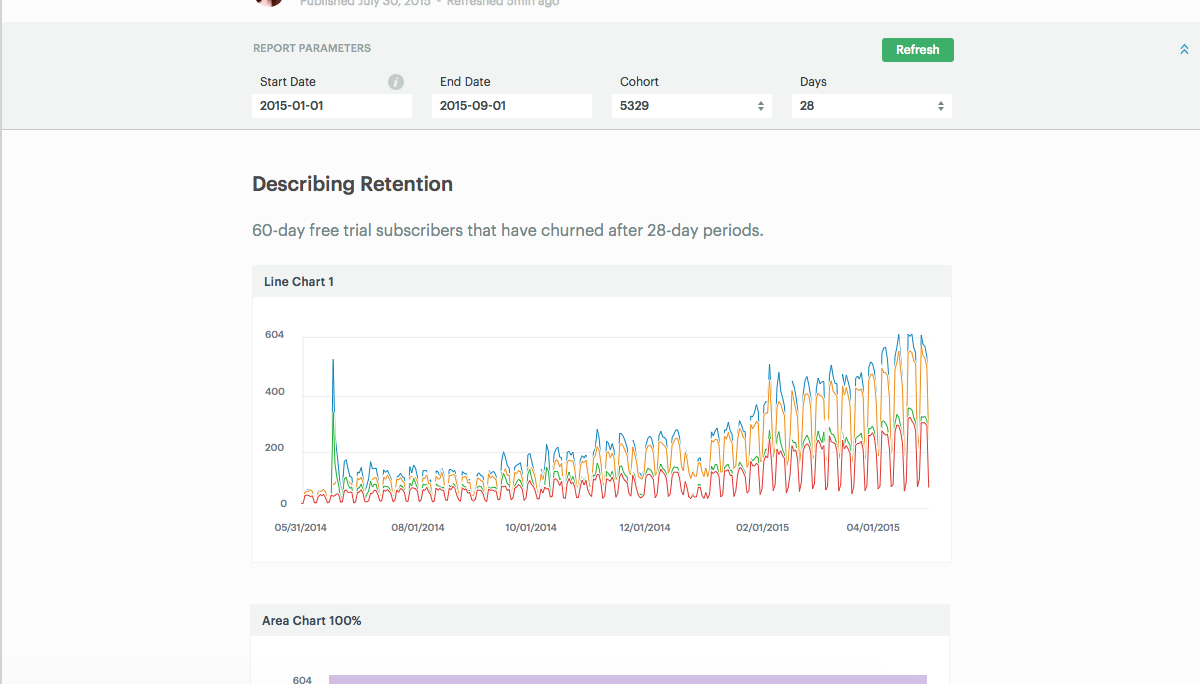
Mode Analytics: For more advanced teams using SQL, Python and R to create data visualizations and dashboards. (Free)
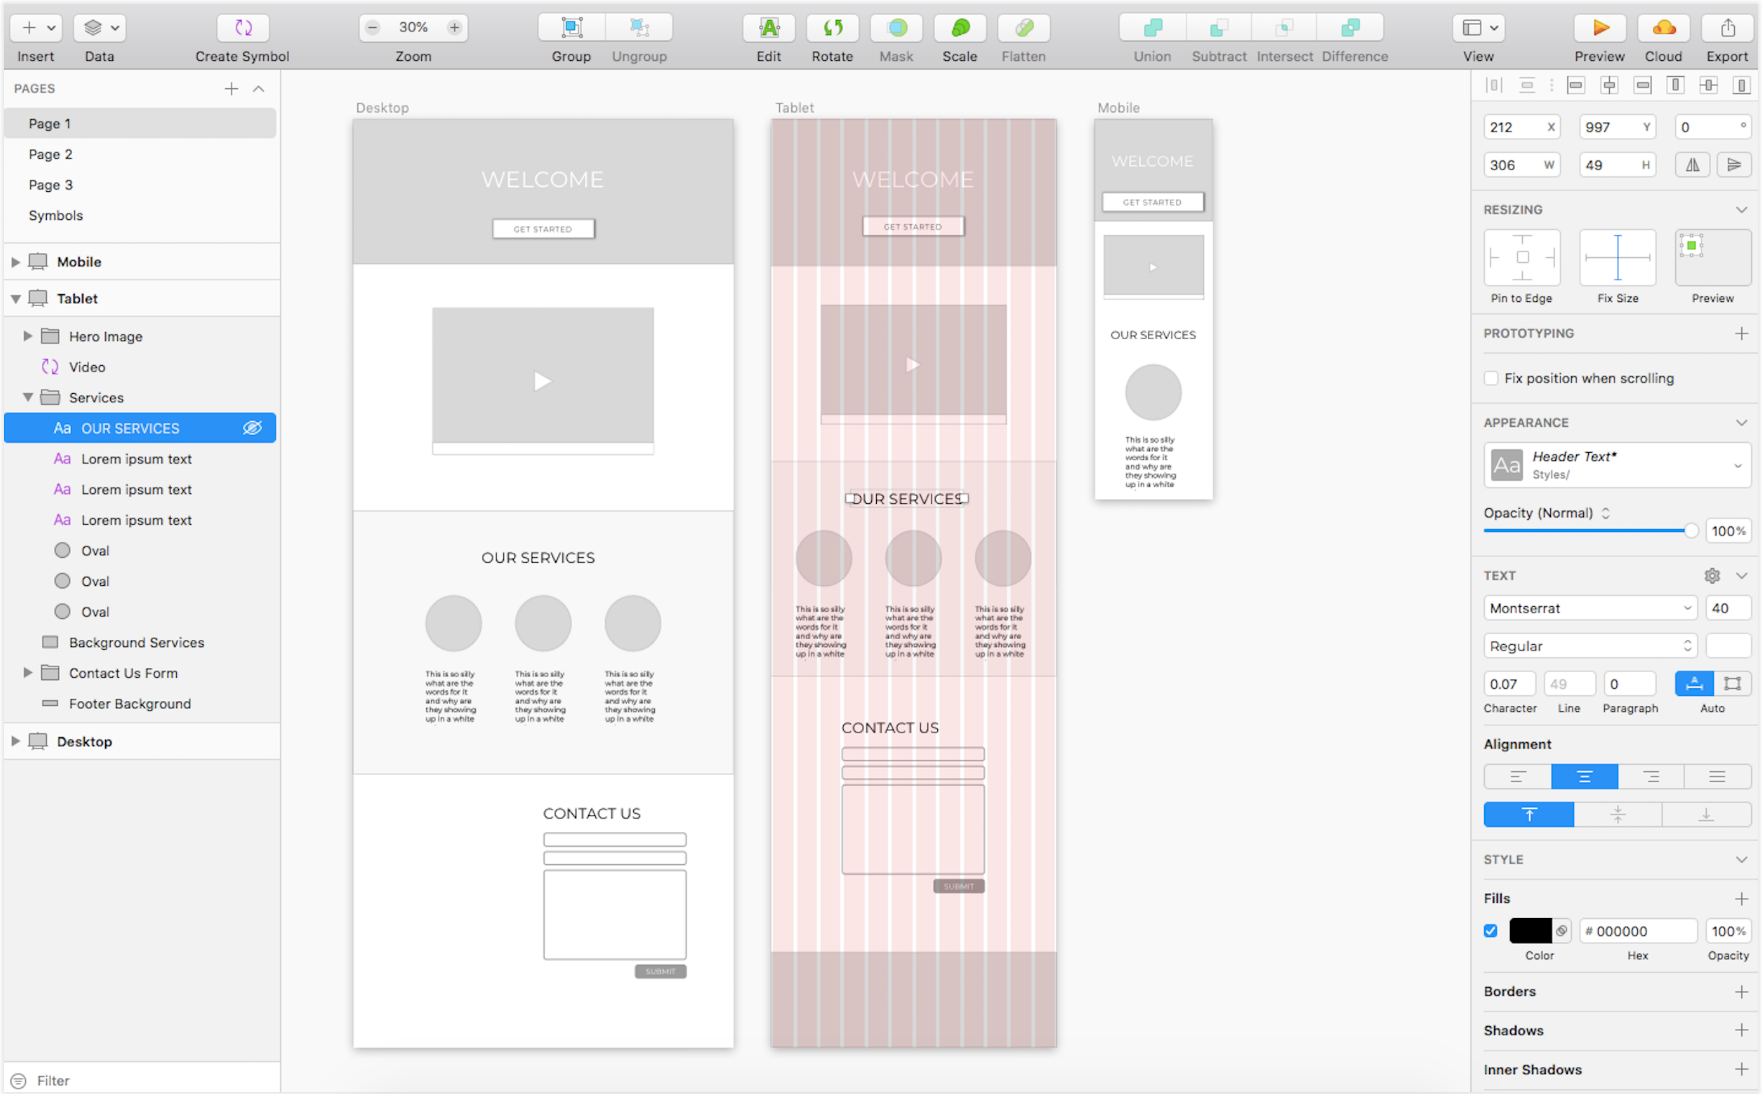
Sketch: For wire framing. We hired our first in-house product designer in February of 2019, which means that we went a good 4+ years leaning on the support of design consultancies and our own photoshop ‘skills.’ So far, Sketch as been the easiest tool to use. It’s intuitive, quickly shareable, and efficient once we uploaded our own design kit. (Free – limited use)
Appcues: For user onboarding, product announcements, NPS, A/B testing, and feedback – without using Engineering resources. Appcues empowered us to communicate and understand our users (freelancers) significantly better. In turn, their performance and overall sentiment improved significantly. ($250-$1000/mo – not free, but worth it if you consider the cost of Eng time)
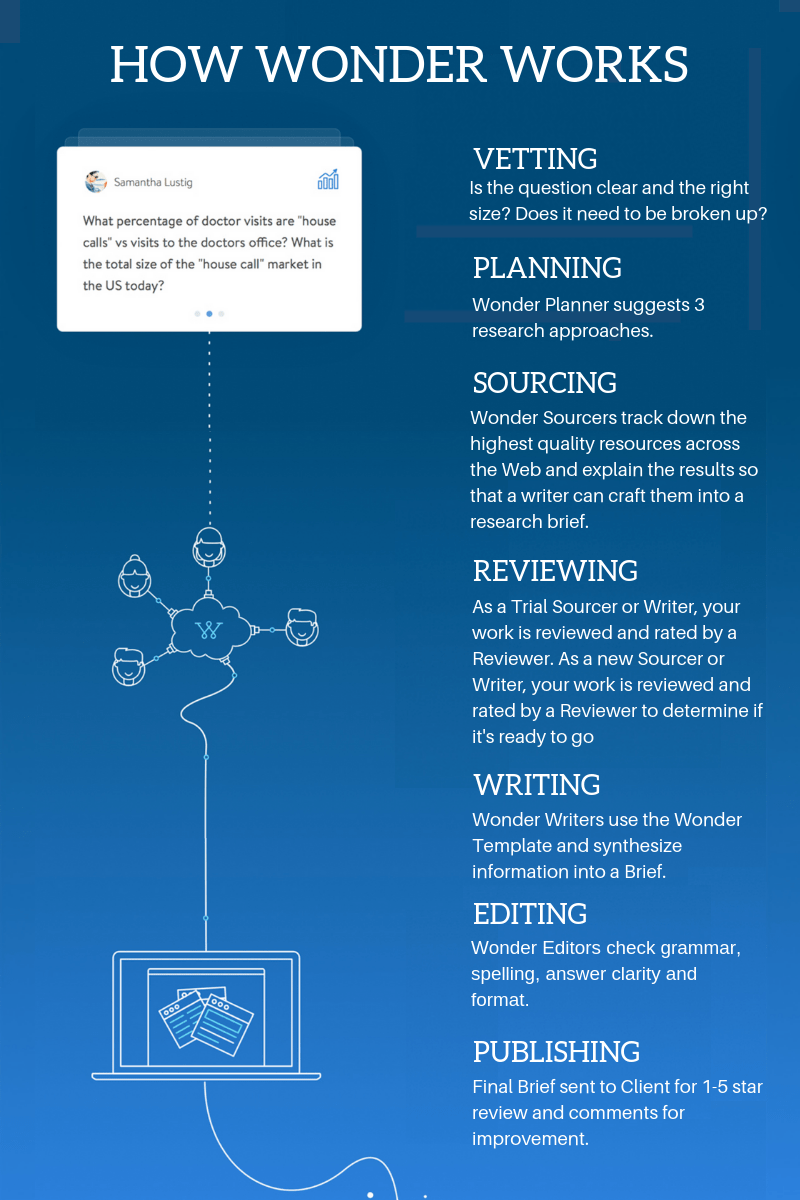
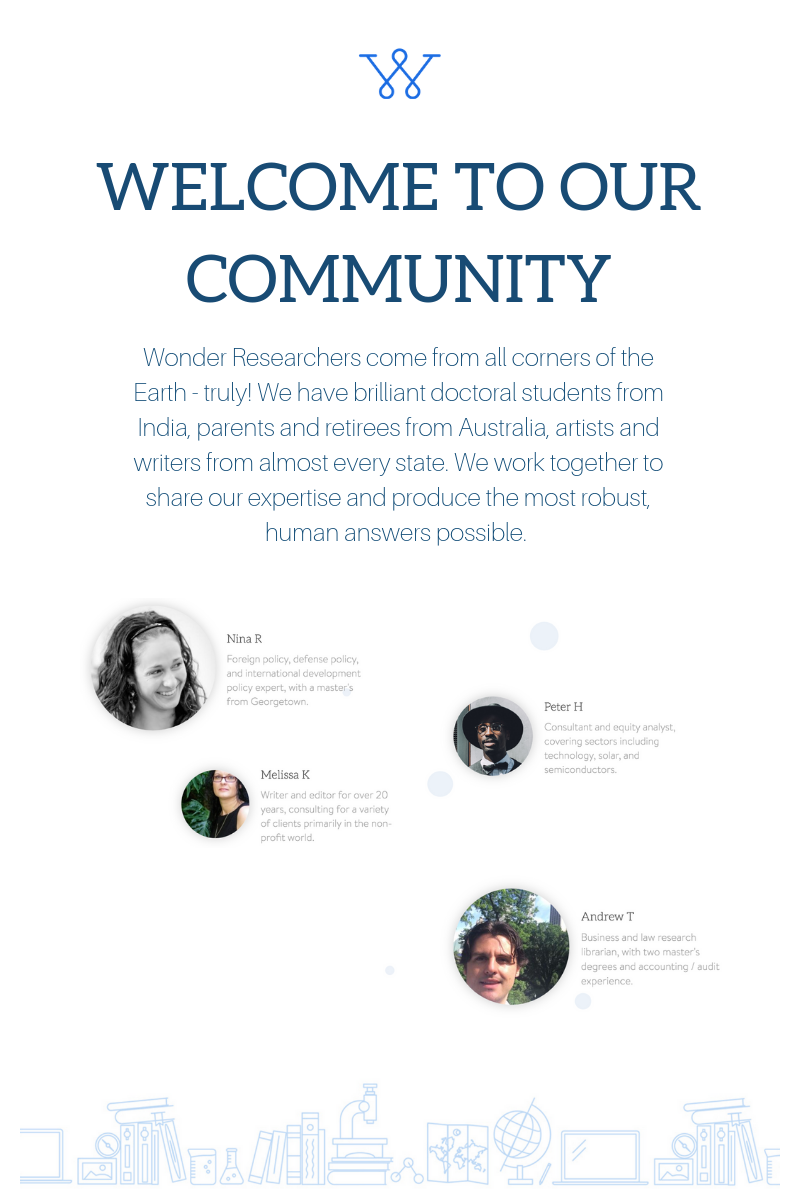
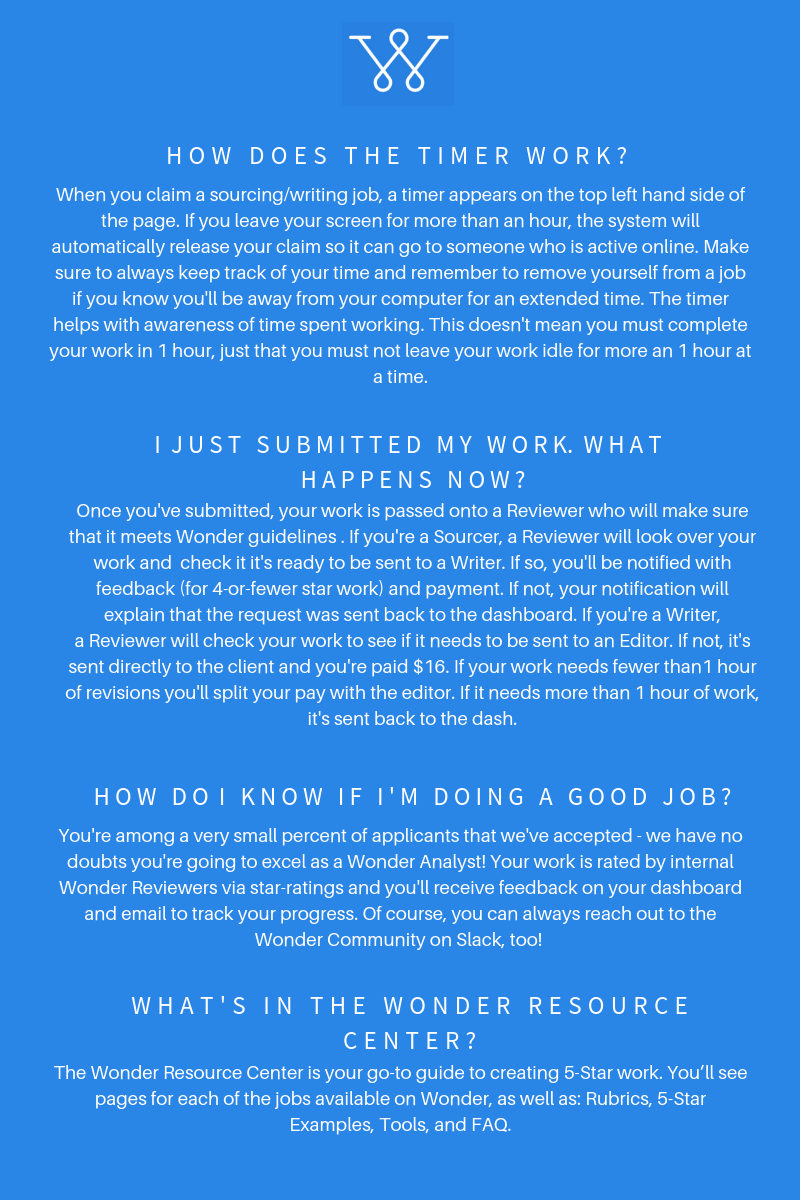
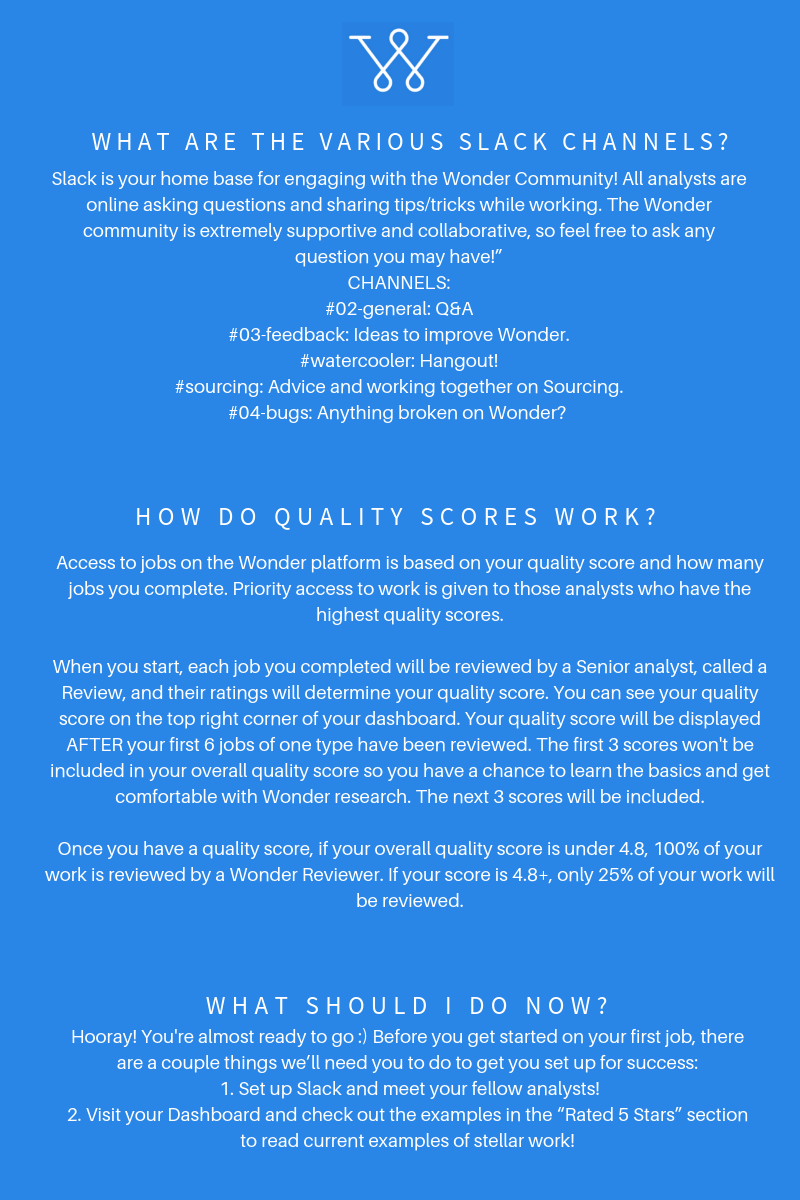
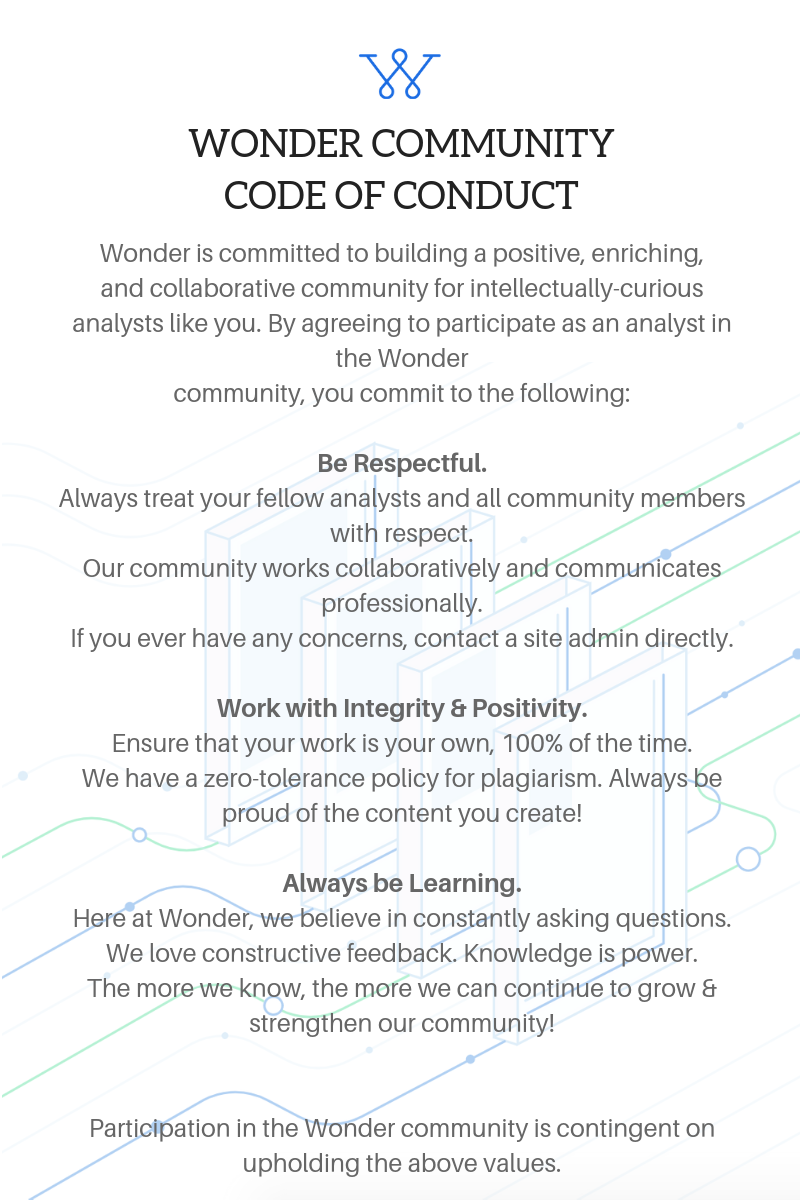
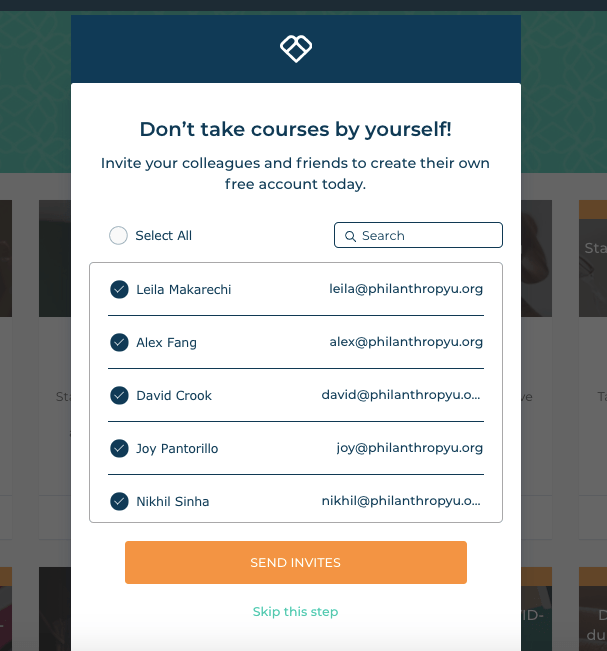
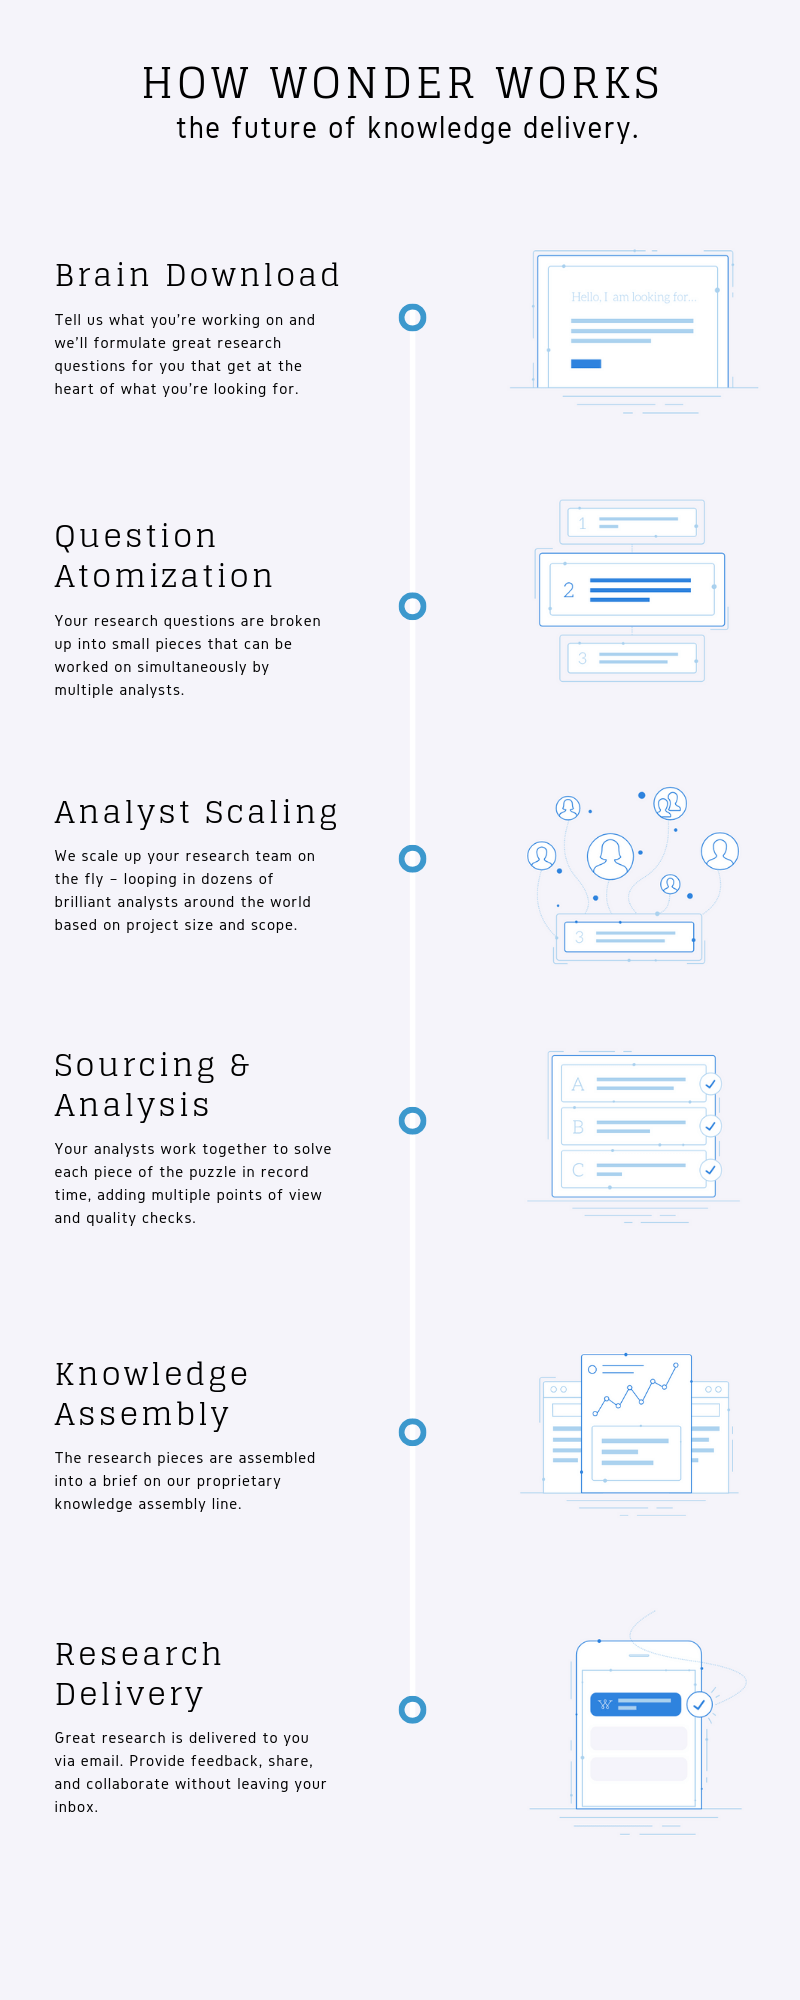
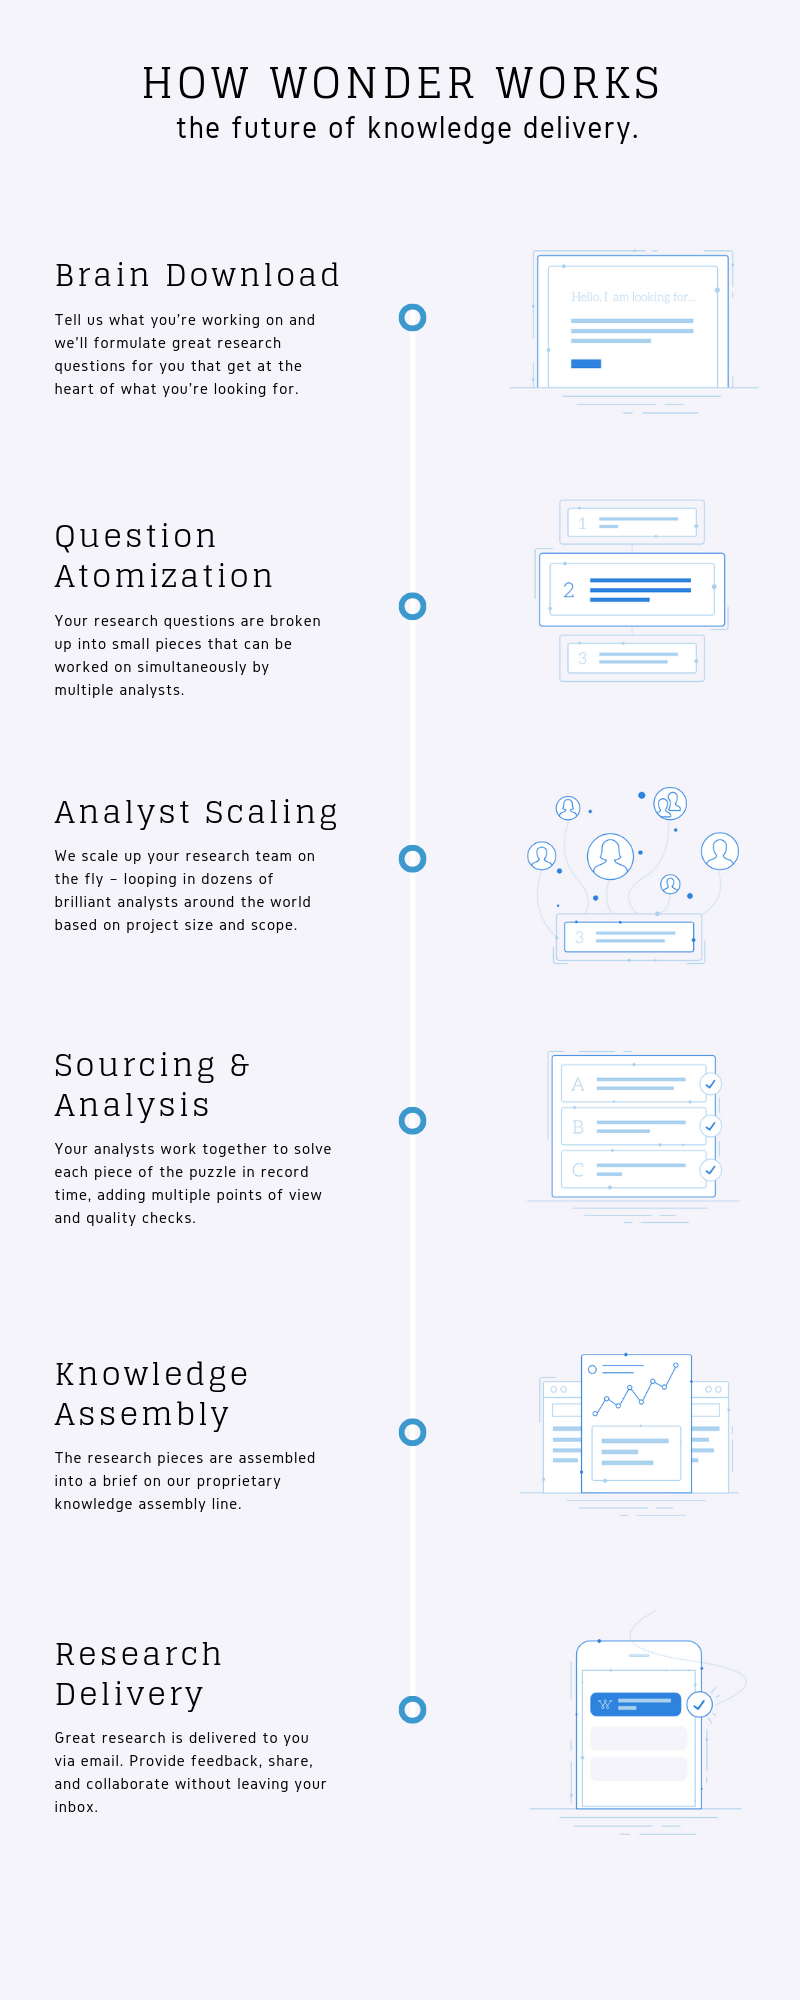
We grew our supply of freelance researchers from 1000 to over 9000 in 2 years. In order to provide each new researcher with a common onboarding experience, I created the Wonder Welcome Packet. This was their first official document, establishing the foundation of their understanding of How Wonder Works, their community of fellow global researchers, and code of conduct.
Onboarding continued with a full orientation and 2 weeks of mentorship with a senior researcher, who supports both research performance and community engagement.
Each time we created a new job in the Research Assembly line, we had to source new Researchers with specific skillsets for the job, test their ability to perform, onboard them, develop feedback tools to maintain high performance, and create strong team comradery.
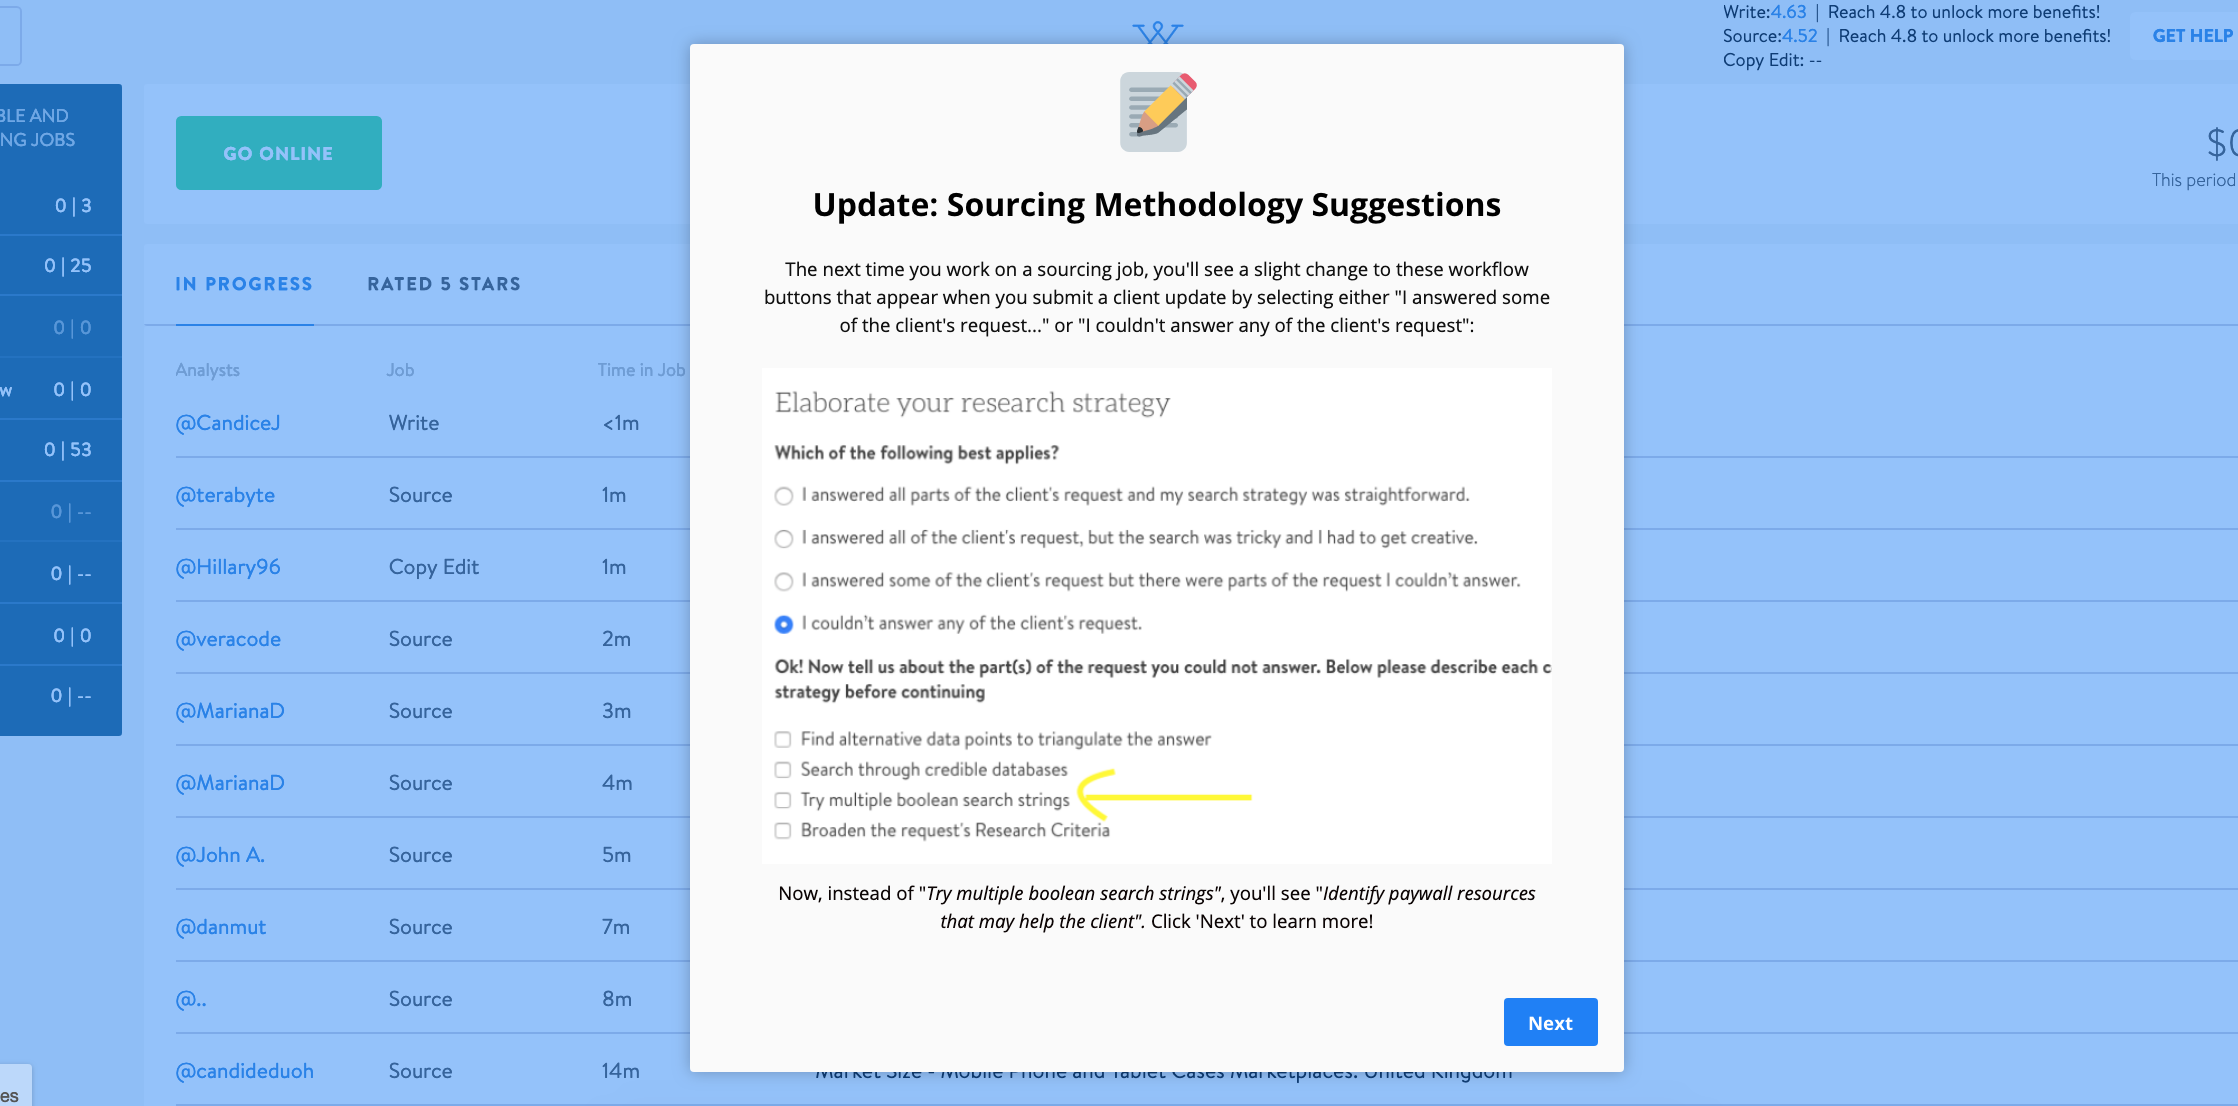
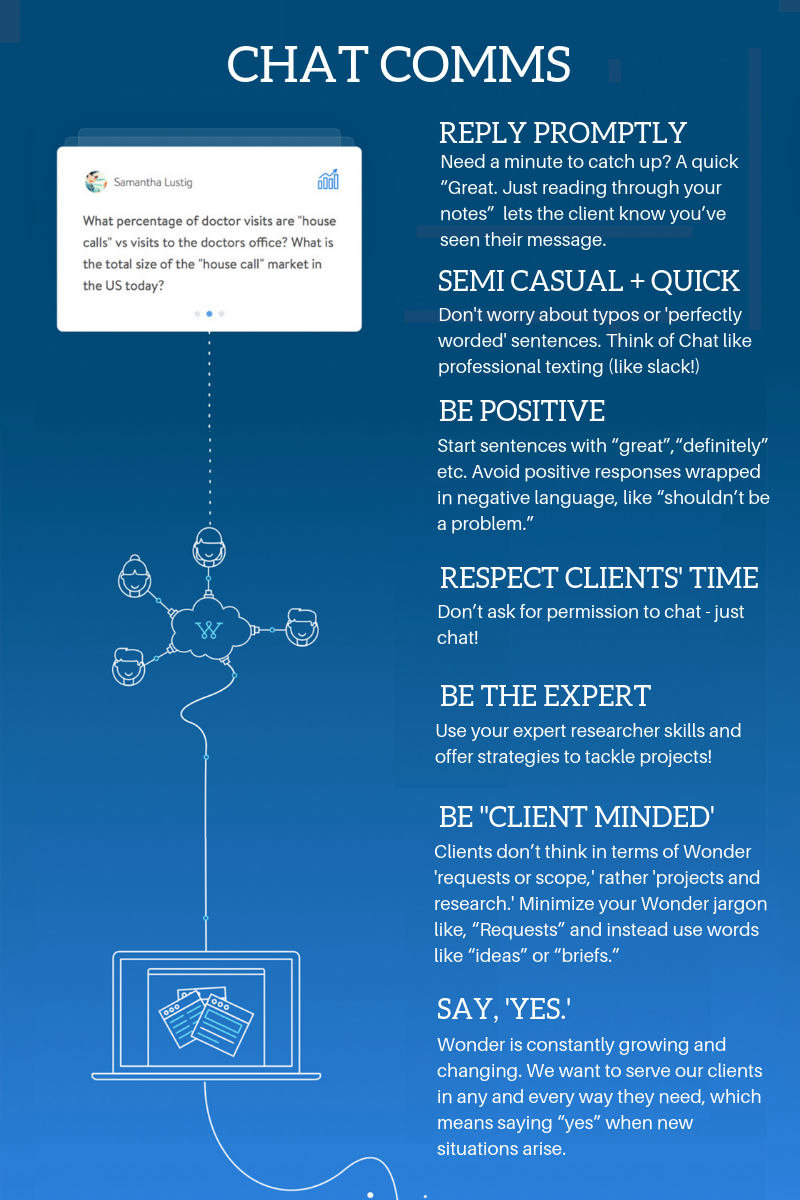
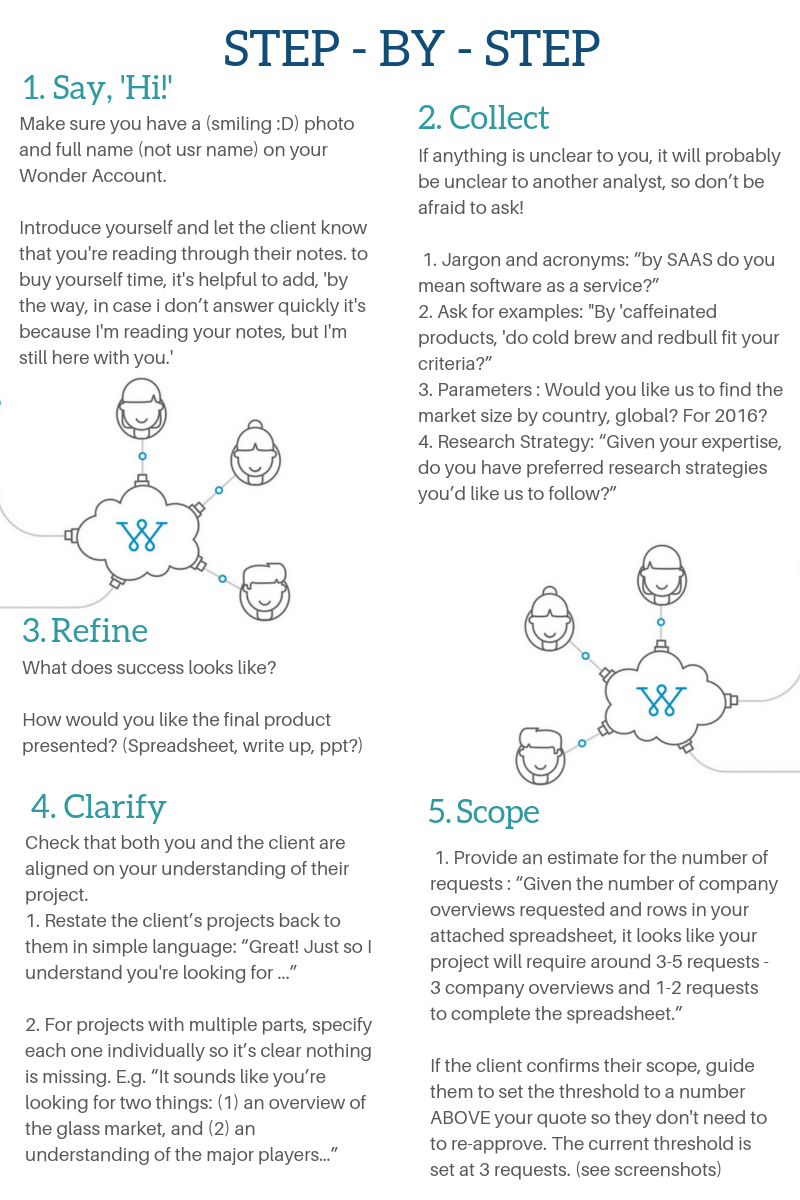
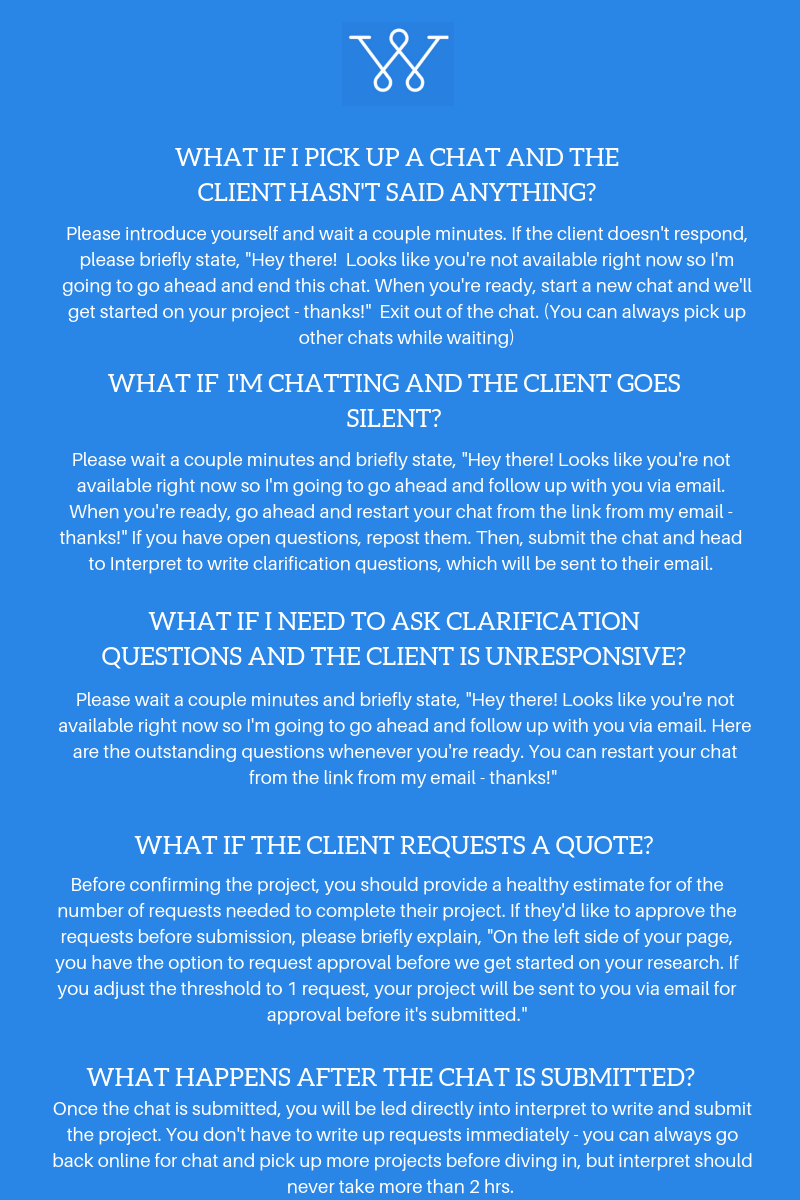
One of these jobs was “Research Consultant.” These Researchers directly conversed with clients, acting as their first line of communication. Research Consultants used “Chat” as their medium of conversation. Below is the onboarding packet I created to welcome them to the team.
The packet is a quick overview of:
How “chat” works: the product they use to consult with clients.
Job expectations: Researcher’s main purpose as consultants.
Communications etiquette: How to communication with clients.
Step-by-Step: Exact actions to take as a research consultant
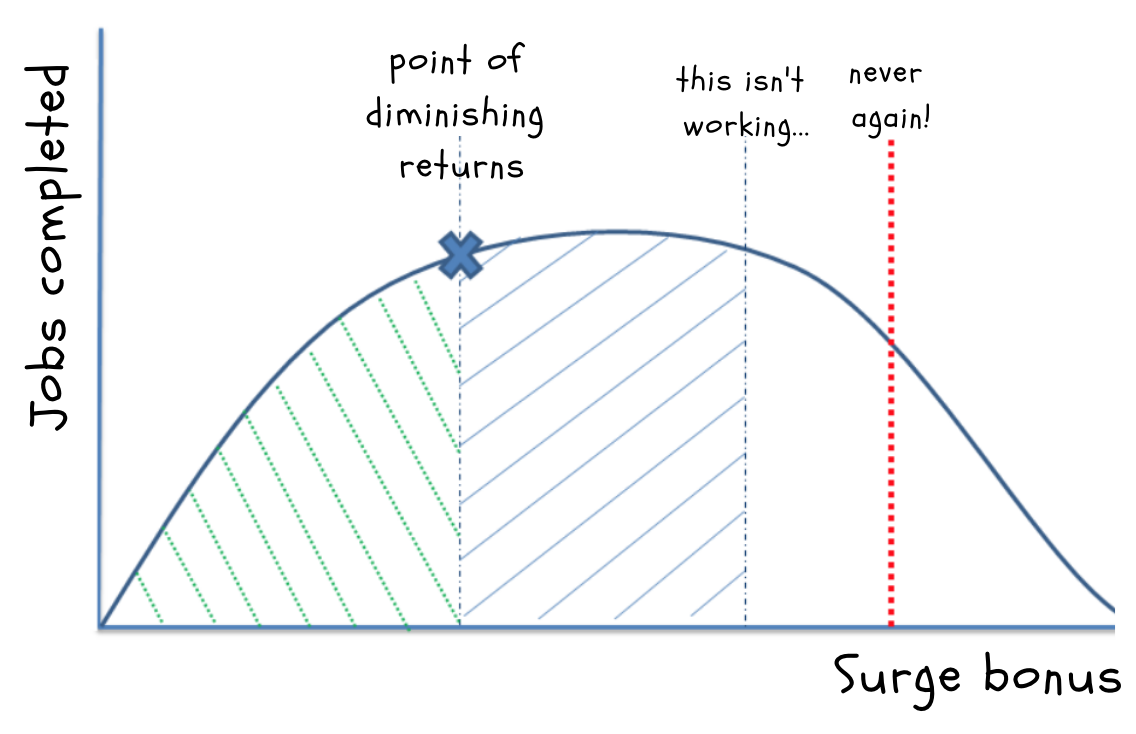
Remember the last time it was raining and you tried to call a lyft or uber? The groan you expressed when you saw the price double and time to pickup grow exponentially longer?
That’s surge pricing. No fun for you, and no fun for lyft or uber. But, very quite lucrative for drivers if they’re incentivized effectively!
Surge pricing occurs when marketplace startups have a supply deficiency. Demand for their service they provide has spiked, and they need to drive more freelancers to work and fulfill this demand – immediately. Otherwise, customers are left waiting, and eventually will abandon the service.
As mentioned in a previous post, there are two main strategies we employed to drive supply to meet demand during a spike:
Linear Surges – Increasing per-job compensation: Essentially, a ‘flash deal’ advertising a higher wages if freelancers choose to work during high-demand hours. Eg. “Earn 20% more on Fridays and Saturdays 9pm-3am.”
Graduated Surges – Increasing per-job prices sequentially: Think ‘loyalty program.’ The more you fly Delta, the more points you earn and the better the rewards get. Eg. “Complete 1-5 jobs and earn 10% more, complete 5+ jobs and earn 20% more per job.”
When we launched linear surges, we generally saw the following increase in active freelancer supply and fulfillment:
measured within 6 hours of surge start & end. note: ‘jobs’ took 2-4hrs to complete, on avg.
Surge Bonus
Active Freelancer Supply Increase
Demand fulfillment Increase
30%
10%
5%
40%
15%
10%
50%
20%
15%
60%
22%
17%
70%
25%
20%
More than often when we needed to surge, it was because demand was 2x or more than normal during that period, compared to previous weeks. This meant that we needed to drive 2x or more supply to maintain consistent production turnaround time.
For us, that meant producing a robust, fact-checked research report in 12-24hrs. For companies with immediate abandonment issues like Uber and Lyft, that means matching a driver with a rider in 10 minutes or less.
As you can see, Linear Surges resulted in 2 main limitations:
It’s too expensive to try to drive 50% more freelancers to work.
At a certain point, a higher surge bonus did not result in more active freelancers or more productive freelancers. (law of diminishing returns)
And so, we experimented with Graduated Surges…
Our hypothesis was that our researchers would react to graduated surges the way consumers react to frequent flyer loyalty points – opting to complete more work on our platform in order to collect greater bonuses.
Results were as expected! When we launched the following Graduated Surge Bonus, we consistently saw a 20% increase in active freelancer supply and ~60+% increase in fulfillment. The same 20% of analysts were incentivized to complete 3x more jobs during the time that we needed them most!
Surge Bonus (per job)
Jobs completed to earn graduated surge bonuses
30%
2
40%
3
50%
4+
The success of graduated surges came from the fact that freelancers were incentivized to earn more for completing more work. During graduated surge periods, they’d complete as many jobs as possible to maximize their earnings.
This meant that we only needed 20% more freelancers to fulfill ~60+% more work during a spike.
Graduated surges were also less expensive because most analysts wouldn’t complete more than 2 jobs during the 12-hr surge period. The boost in job fulfillment came from a very small population of highly productive senior researchers who completed 5+ jobs during graduated surges. Overall, everyone was happy with graduated surges!
Margins were 30% greater.
Freelancer Productivity was 3x greater.
We were able to increase the % of research completed within 24 hrs from 80% to 95% consistently.
Instead of taking the high-effort, high-cost, high-risk route of trying to increase our active supply of researchers, we took the more thoughtful route and simply increased the productivity of supply of our researchers by giving them better incentives work more. In the end, we didn’t need more researchers, we just needed more active ones!
With 260 million people spread across the world’s largest archipelago of 17,000 islands, Indonesia faces a unique challenge – unequal distribution of infrastructure. Some Indonesians, particularly in remote islands, have to travel for days to just to reach a doctor. In Maluku and Papua, the doctor to patient ratio is 1:1625, compared to the US where the ratio is closer to 1:250.
Between 2013-2015, DoctorSHARE performed over 1000 free surgical operations and hundreds of public health guidance programs for remote islanders. In 2016, our team led by Julia Tan (PT Multi Agung Sarana Ananda) raised 1 million dollars to convert a donated oil barge into a floating hospital. http://floatinghospital.doctorshare.org/
Background: At Philanthropy University, our mission is to increase the capacity of grassroots CSOs to progress the 2030 UN Sustainable Development Goals (SDGs). We approach our mission with 3 products: online courses, community, and capital investments. The majority of our social entrepreneurs work in regions of the world where internet access is expensive and sparse, so designing for accessibility in their environments is crucial.
Financial independence and revenue generation became a priority towards the middle of 2019. Generating at least $50m in ARR by 2025 became our north star. But before we could start design and development processes to build a revenue generating business line, we had to audit our finances.
Until then, only our Director of Marketing and CEO knew that we were spending more than $70,000/mo to acquire free users. When I joined at the end Q3 2019, a few of of my first tasks were to severely decrease the cost of acquisition(CAC), define our new target market user (TMU), and triple acquisition of our TMU.
For the sake of focus, I will not go into how our TMU was determined. We defined our TMU as social impact organizations with between 10-100 employees who work in the global south and are high potential candidates for funding from major US-based foundations. This TMU has since changed now that we’re more aggressively pursuing revenue and building a spinout BCorp.
Our major question: How might we halve CAC, triple TMU acquisition and maintain rigorous data collection?
Our approach: Luckily, I’d just worked on lowering CAC at Mystery Science and learned from their outstanding growth and data team, so I had a head start. This was our approach:
Marketing spend analysis: How much are we spending? On what platforms? How are the campaigns performing? What have we tried, not tried?
User behavior data analysis: Where to leads go when they’ve clicked through an ad? Where do they get stuck? Where and when do they bounce? What do we do (if anything) to get them back? Do we encourage existing users to refer? How?
Case studies and conversations with mentors: Lots of secondary research to understand marketing and registration flow best practices, interesting approaches from mentors who’ve been optimizing acquisition for decades.
Primary research: Interviews with existing and prospective users about registration and the perceived value of our product offering, as presented in our ads.
Screen recordings: Watching users interact with our registration flow to understand bottlenecks, limitations, and frustrating experiences
Experiments: After reviewing our data and research, we prioritized hypotheses to test via study groups or on-platform experiments.
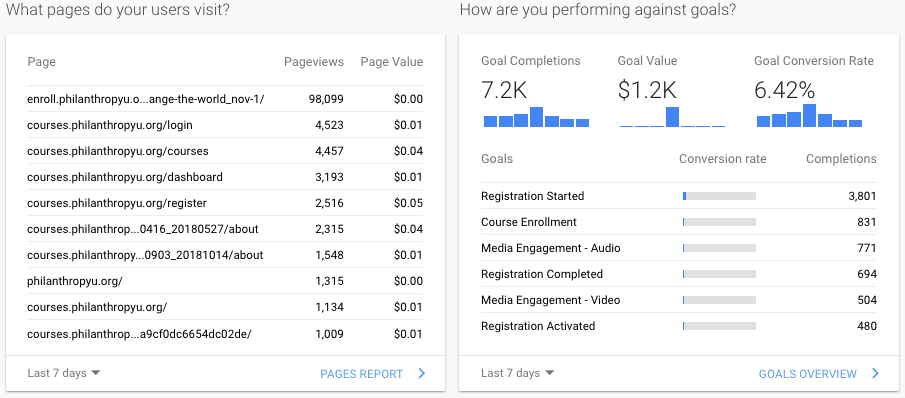
Data for marketing performance, lead funnels, demographics, and the registration flow
Research highlights:
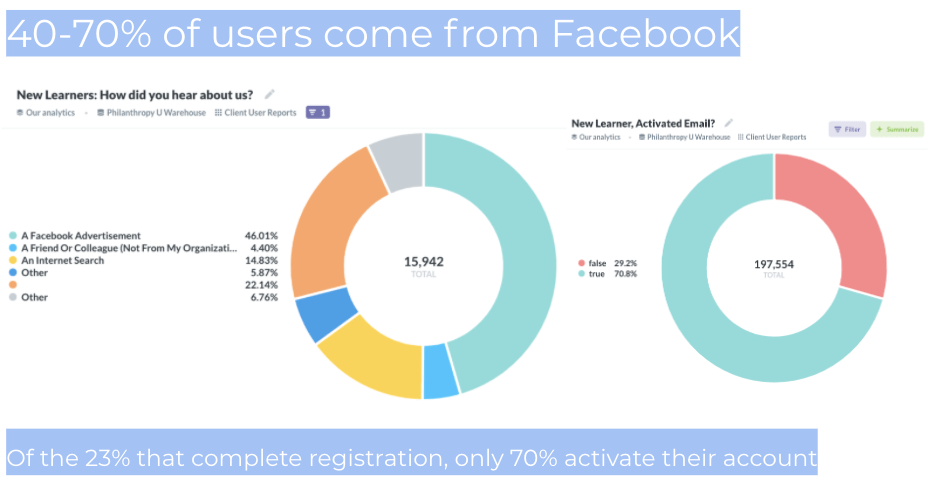
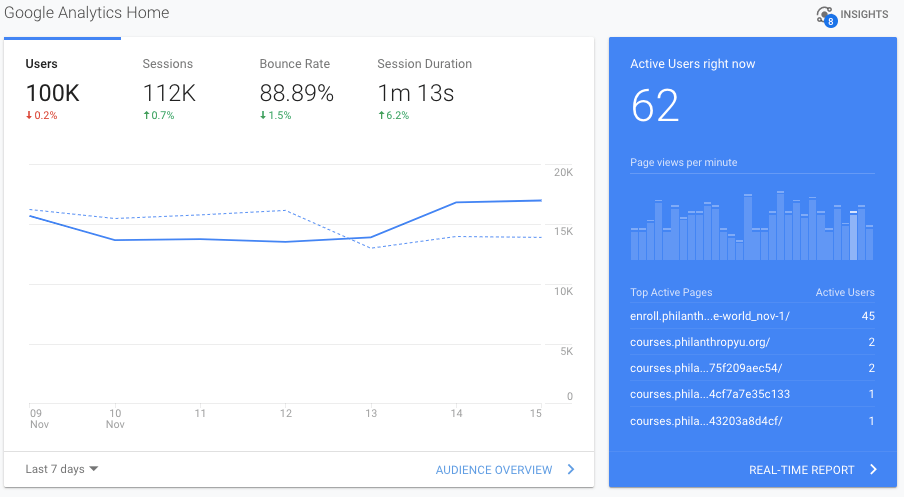
Keeping ad spend the same, we had about 100,000 unique visitors weekly. Of those, around 3000 visitors completed registration. Of those, ~100 were our TMU. Overall CAC for our TMU was over $400.
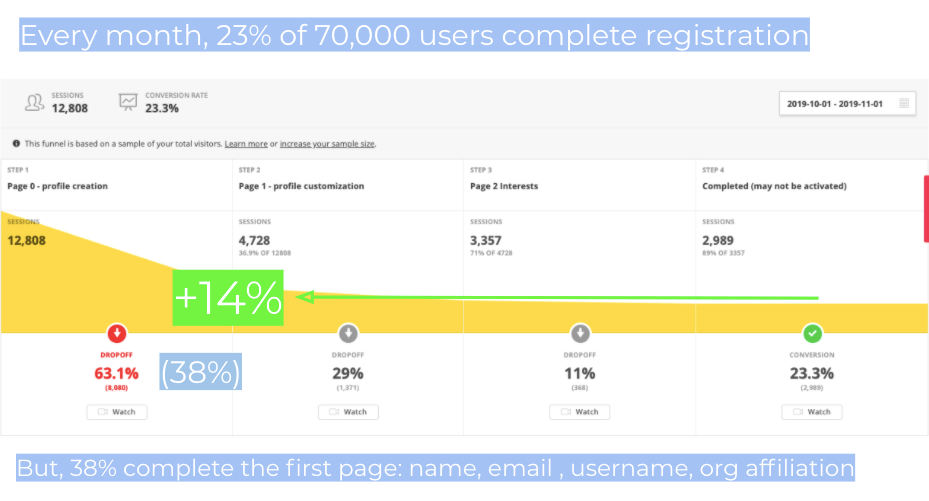
~63% of leads never made to registration, but those who did were often stuck on a few of the 40+ questions, many of which we didn’t use in our analysis or reporting to funders.
~75% of leads that completed registration did not activate their account, which is required before they can take any actions on the site.
English is a second (or third, fourth) language for many leads, so particular questions did not translate well to their native language or to the political or legal structures in their countries (eg. business type: social enterprise, nonprofit, NGO, etc. have various meaning in different countries)
Major opportunities included:
Decreasing the complexity and effort to complete registration
Giving users an opportunity to explore the platform before creating the friction of registration or account activation.
Creating the opportunity for users to easily make referrals.
Experiments: We prioritized 4 RCT A/B tests to run over the following month. Our KPIs were overall registrations, TMU registrations, TMU CAC and TMU activation (account activation via post registration).
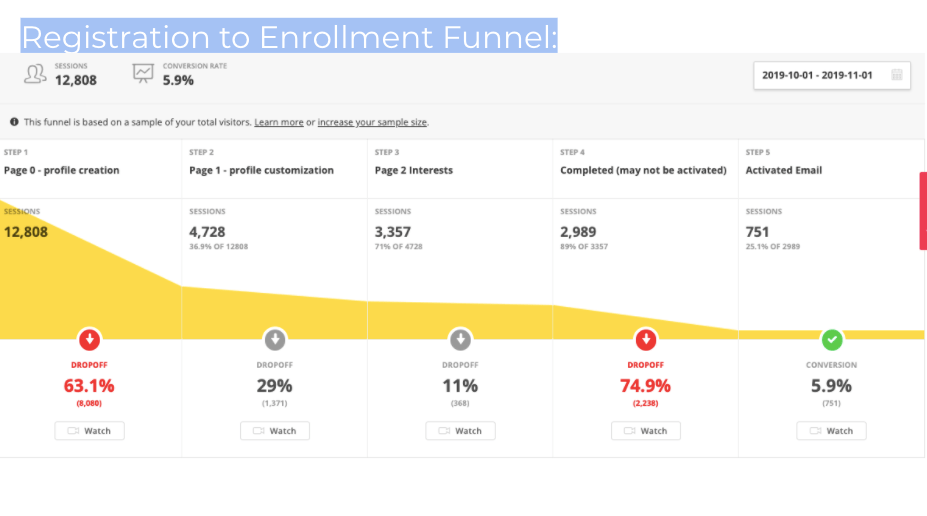
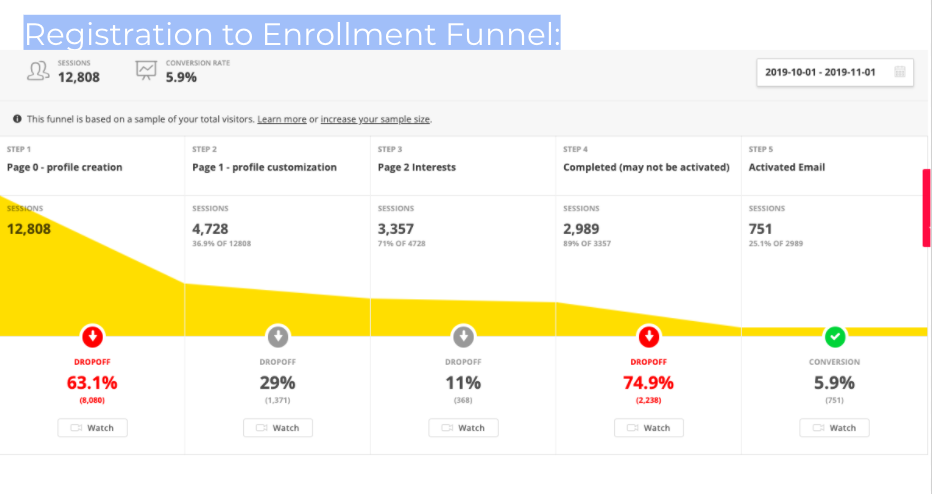
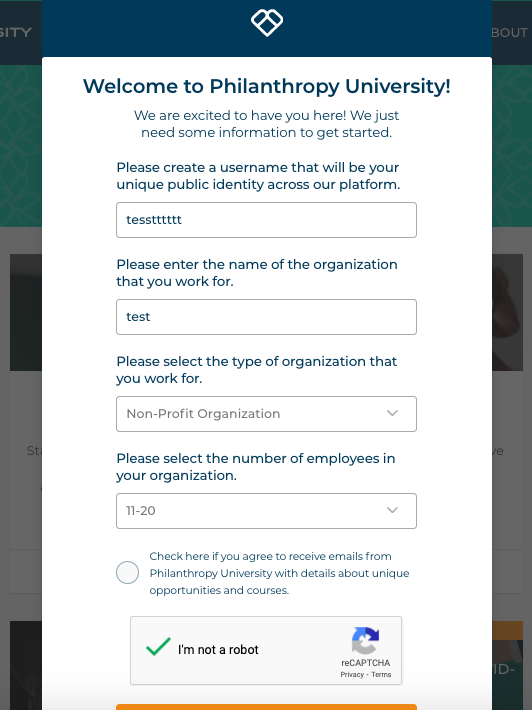
Control: The majority of new users came from facebook ads and were prompted to complete 3 basic registration questions, followed by 40 demographic questions. Users then had to activate their account via email before they could explore the platform. Dropoff from registration start to account activation looked like the image below.
Localized Language: Treatment group was given the same registration questions, but in their local language with tooltips for words without direct translations
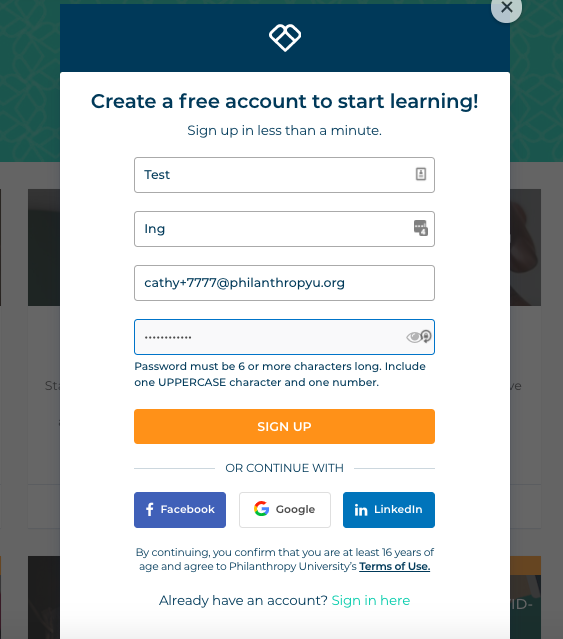
Simplified Registration: Above, plus the treatment group is given only 7 registrations questions v. 40. Also, registration is in a modal on top of any page v. on a separate page.
Removing Account Activation within the same session: Treatment group can take actions (enroll in courses, chat in forums, etc) within the same session without having to activate their account first.
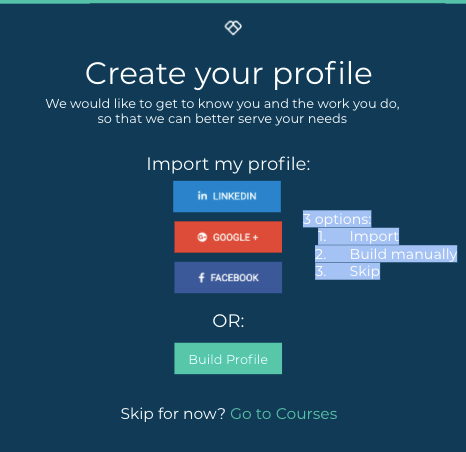
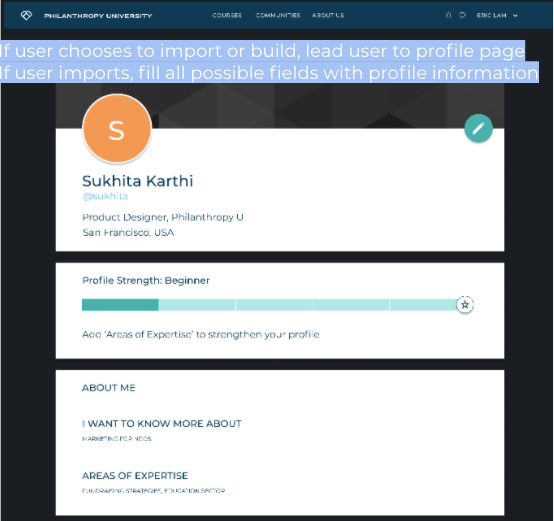
Profile import: Above, plus the treatment group is given the opportunity to connect their LinkedIN, Google or Facebook account data to complete the 40 registration questions automatically, instead of manually completing each question.
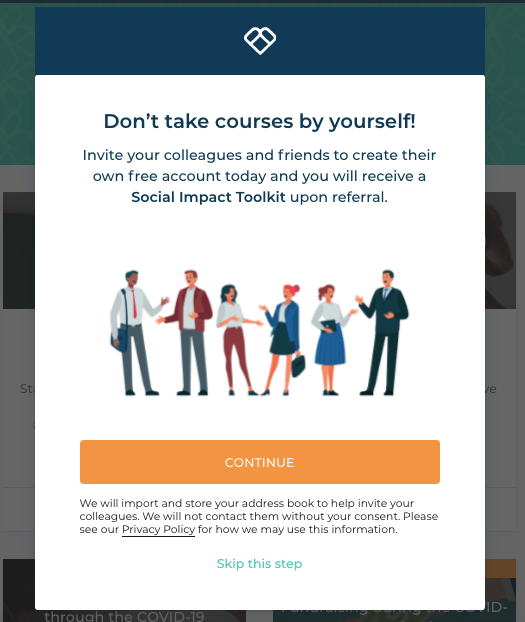
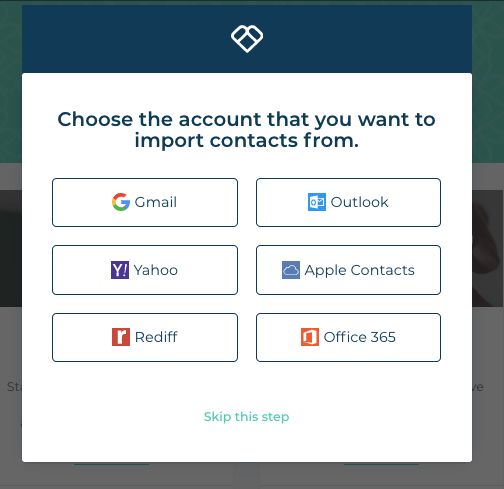
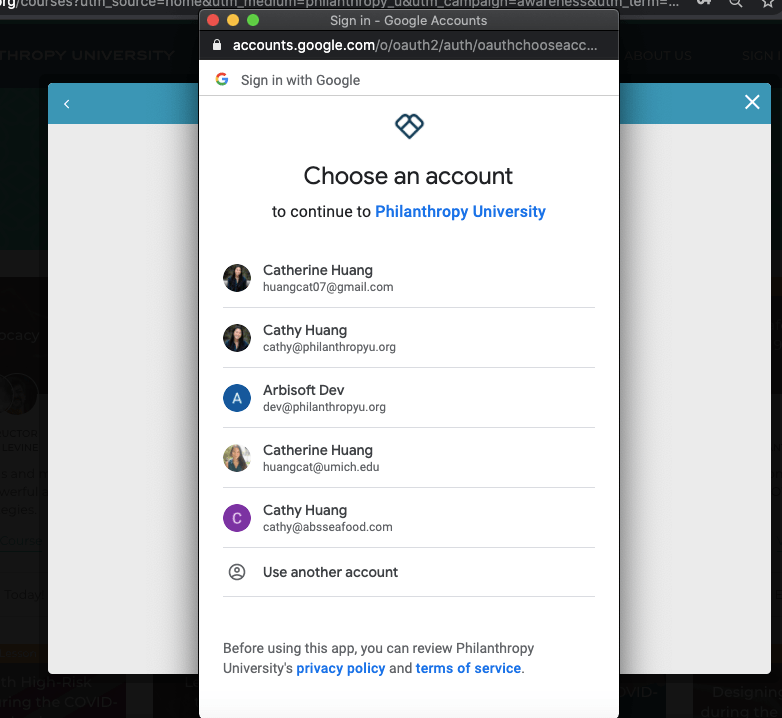
Smart Referral: All leads are limited to 7 questions, but the treatment group is prompted to connect their email address book and empowered to automatically refer 10 peers with the same email domain.
Experiment Outcomes: In sequential order based on effort/potential impact.
Localized Language:
Overall registrations: No significant change
TMU registrations: No significant change
TMU CAC: No significant change
TMU activations: No significant change
Simplified Registration:
Overall registrations: ~2x increase in registration completions
TMU registrations: ~2x increase
TMU CAC: ~1/2, or ~$200 per TMU registration
TMU activations: No significant change
***However, we lost a lot of valuable data by cutting registration down from 40 to 7 questions.
Removing Account Activation within the same session:
Overall registrations: No change
TMU registrations: No change
TMU CAC: No change
TMU activations: ~3x increase
Profile import:
Overall registrations: ~1.5x increase in registration completions
TMU registrations: ~1.5x increase
TMU CAC: ~3/4, or ~$300 per TMU registration
TMU activations: No significant change
***Not as good as simple registration on its own bc some users do not have LinkedIN, Google or Facebook accounts so they didn’t reap the benefits of automatic profile creation
Because that population was so small, we decided to add a ‘skip’ option.
Smart Referral:
Overall registrations: ~7x
TMU registrations: ~10x
TMU CAC: ~1/10 or $40 per TMU
TMU activations: No significant change
After about a month of experiments, we decided to build the following:
Simplified Registration
Remove Account Activation within the same session
Smart Referral
Overall effort was ~2 months of engineering and 1 week of product design. Pretty high, but worth it! Within 2 months of being live, we saw the following combined outcomes:
Overall registrations: ~7x
TMU registrations: ~14x
TMU CAC: 1/20 or ~$20 per TMU
TMU activations: ~5x
Network effects of smart referral were compounding. For every TMU we attracted, another 7 more would be referred and successful register. After about 4 months, we decreased TMU CAC to ~$4/user and were able to save ~$70,000 per month on ads.
Network effects were also beneficial for NPS, completion rates and skills growth because more Learners were able to create team-based learning groups or classrooms to learn alongside their peers.
The presentation below is an overview of some work I focused on as a Product Manager at Wonder. I used this deck to share my experience with prospective employers when I moved from Brooklyn to Oakland.